Harry Brook once again underlined his extraordinary batting range after producing a sensational start to England’s T20I series against Sri Lanka. The right-hander smashed 114 off just 49 balls in the opening match before adding another 23 from eight deliveries in the second T20I, taking his tally to 137 runs from two innings at a strike rate of 240.35.
With Brook now reaching the 172-innings mark in his international career, an intriguing comparison emerges with one of England’s most prolific batters and a cricketer with a similar profile, Kevin Pietersen. Let’s take a look at how the two batters compare across Tests, ODIs and T20Is at this stage.
Harry Brook vs Kevin Pietersen in Tests after 172 innings
Harry Brook and Kevin Pietersen have occupied very different roles despite both being middle-order run-makers. Brook's Test numbers are remarkable. Across his 70 innings, he has accumulated 3610 runs at an average of 53.09 with 10 centuries and 20 fifties.
Stat
Kevin Pietersen
Harry Brook
Innings
80
70
Runs
3890
3610
Highest Score
226
317
Batting Average
50.51
53.08
100s
14
10
50s
11
20
[Harry Brook vs Kevin Pietersen in Tests after 172 international innings]
His record is even stronger at No. 5, where he has scored 3512 runs from 64 innings at an average of 55.75, including all 10 of his hundreds.
Pietersen's first 172 international batting innings produced 7300 runs at 47.71, with 21 centuries and 32 fifties. His career record also included matches for the ICC World XI.
Brook's average is higher, but Pietersen's numbers came during an era when Test batting was generally less dominated by the aggressive scoring rates seen in the modern game.
Pietersen's ability to attack from the middle order while consistently producing substantial scores made him a distinctive batter of his generation.
Brook's numbers are statistically superior at this stage, but the era and circumstances make a direct quality comparison far less straightforward.
Harry Brook vs Kevin Pietersen in ODIs after 172 innings
Brook has played 41 ODIs and has 1,385 runs from 41 innings at an average of 37.43 and a strike rate of 105.16. His most productive position has been No. 5, where he has scored 618 runs at an average of 41.20. At No. 4, he has 710 runs at 37.37.
Stat
Kevin Pietersen
Harry Brook
Innings
78
41
Runs
3047
1385
Highest Score
116
136*
Batting Average
48.36
37.43
Balls Faced
3479
1317
Strike Rate
87.58
105.16
100s
7
3
50s
20
6
[Harry Brook vs Kevin Pietersen in ODIs after 172 international innings]
Pietersen's first 172 international innings naturally give him a much larger body of work, but the important point is how he operated in 50-over cricket.
His ODI career was built around converting starts into match-defining scores while maintaining a scoring tempo that was aggressive for his period.
Harry Brook's strike rate of 105.16 is significantly higher than what was normal for elite ODI batters during much of Pietersen's career. That reflects not only Brook's attacking approach but also the evolution of ODI cricket, particularly fielding restrictions, batting conditions and scoring patterns.
Therefore, Brook's current ODI numbers look impressive, but Pietersen's output needs to be judged against the environment in which he produced it rather than today's scoring standards.
Harry Brook vs Kevin Pietersen in T20Is after 172 innings
Brook's T20I record perhaps provides the clearest statistical contrast. He has scored 1,669 runs from 61 innings at an average of 36.28 and a remarkable strike rate of 165.08.
His best work has come at No. 3. In nine innings there, Brook has scored 499 runs at an astonishing average of 83.17 and a strike rate of 203.67. His 114 against Sri Lanka has further strengthened that record. He has also contributed 490 runs at No. 4 and 619 at No. 5.
Stat
Kevin Pietersen
Harry Brook
Innings
14
61
Runs
363
1669
Highest Score
79
114*
Batting Average
27.92
36.28
Balls Faced
244
1011
Strike Rate
148.77
165.08
100s
0
2
50s
1
8
[Pietersen vs Brook in T20Is]
Pietersen's first 172 international innings, however, include only a comparatively small T20I component because the format was still in its infancy during his career.
On the numbers alone, Harry Brook has the stronger statistical profile at this stage, particularly with his Test average and extraordinary T20I scoring rate. His dominance at No. 5 in Tests and No. 3 in T20Is also shows that his output is not simply a product of one batting position.
Stat
Kevin Pietersen
Harry Brook
Innings
172
172
Not Outs
19
21
Runs
7300
6664
Highest Score
226
317
Average
47.71
44.13
50s
32
34
100s
21
15
Ducks
8
8
[Brook vs Pietersen overall]
But calling Brook the greater batter based solely on those figures would miss the context surrounding Pietersen's career since he bears a better profile across formats with his average. Pietersen played international cricket in a considerably different era, when scoring at his tempo was less common, and the T20 revolution had barely begun.
Brook is producing numbersthat suggest he belongs in the conversation. Pietersen, however, established his reputation across an era with different demands and helped redefine how an English batter could attack international bowling.
The overall numbers belong to Pietersen because he played more Tests, but statistically, too, both are great batters of their generations and possess almost identical capabilities to dismantle bowling attacks.





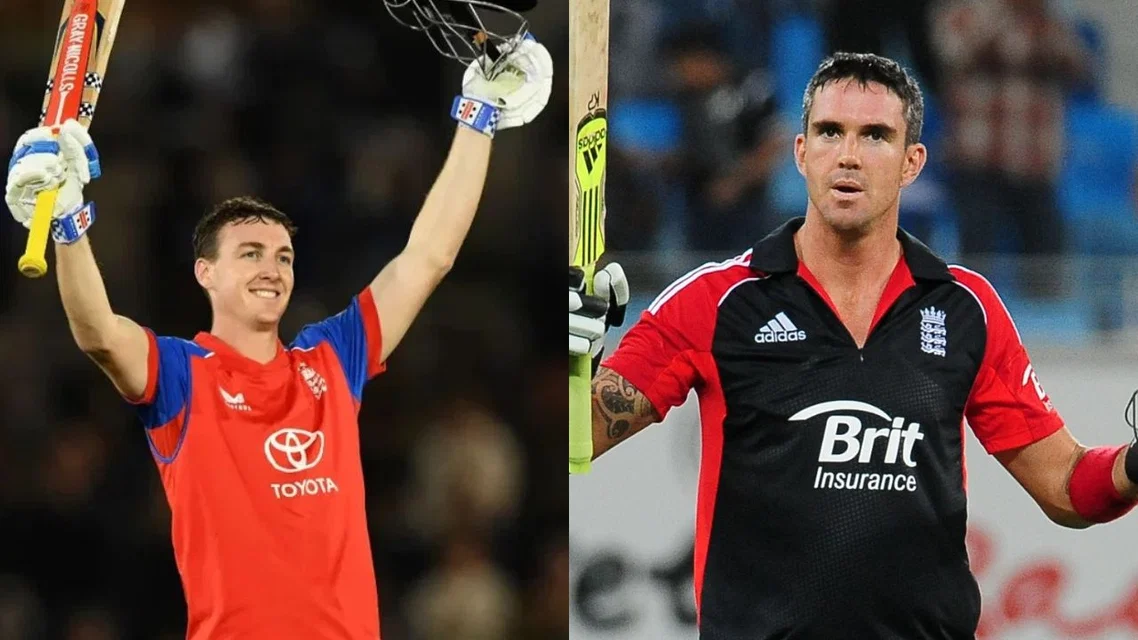 Harry Brook and Kevin Pietersen [Source: AFP]